2 Types of Business Analytics
Business analytics can be divided into several types, each addressing different kinds of decision-making needs and business processes. Here are the primary types of business analytics:
Types of Business Analytics
| Type | Description | Key Features | Examples |
|---|---|---|---|
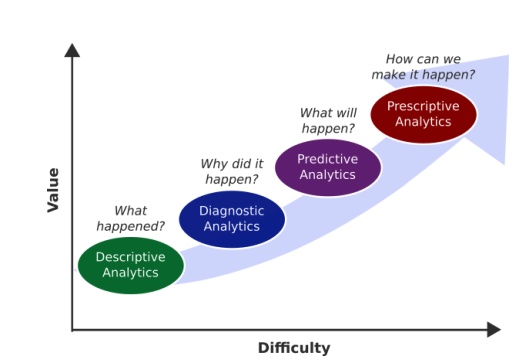
| Descriptive | Focuses on describing or summarizing past data to understand what has happened in the business. | - Uses data aggregation and data mining techniques. - Provides insights into past performance. |
- Sales reports - Customer churn rates |
| Diagnostic | Examines past performance to determine the causes of past success or failure. | - Involves data discovery, correlations, and drill-downs. - Answers “why did it happen?” |
- Root cause analysis - Performance discrepancies analysis |
| Predictive | Uses statistical models and forecasts techniques to understand the future. | - Employs statistical algorithms and machine learning. - Predicts future trends and outcomes. |
- Market trends forecasting - Demand prediction |
| Prescriptive | Suggests actions you can take to affect desired outcomes. | - Combines insights from all other analytics. - Recommends decisions using optimization and simulation algorithms. |
- Supply chain optimization - Dynamic pricing strategies |
| Cognitive | Mimics human brain function to improve decision-making. | - Utilizes artificial intelligence and machine learning. - Enhances human decision-making with insights from data analysis and pattern recognition. |
- Chatbots for customer service - Personalized marketing |
Classification of Business Analytics
 source:
2.1 Descriptive Analytics
Descriptive analytics is the examination of historical data to understand changes that have occurred in a business.
By analyzing past events and performances, descriptive analytics helps organizations understand the reasons behind success or failure, identify trends, and make informed decisions. It is often considered the first step in the broader field of business analytics, laying the groundwork for more advanced predictive and prescriptive analysis.
2.1.1 Key Components of Descriptive Analytics
Data Aggregation and Summarization: Gathering and consolidating data from various sources to provide a coherent overview. This includes compiling reports, dashboards, and visualizations that represent complex datasets in an accessible format.
Data Mining: Exploring large datasets to find patterns, correlations, and insights. This involves techniques such as clustering, classification, and association analysis to uncover hidden patterns in data.
Trend Analysis: Identifying consistent patterns or trends over time. This can involve moving averages, time-series analysis, and seasonal decomposition to understand temporal changes and cyclic patterns.
Visualization: Presenting data in graphical formats, such as charts, graphs, and heat maps, to help stakeholders quickly grasp the insights contained in the data. Effective visualization is crucial for communicating findings and supporting decision-making processes.
2.1.2 Applications of Descriptive Analytics
Descriptive analytics finds applications across all sectors of business, helping organizations to measure, track, and optimize their operations and strategies. Here are some key applications:
Performance Metrics and Benchmarking: Businesses use descriptive analytics to track performance metrics such as sales revenue, customer acquisition costs, and operational efficiency. By comparing these metrics against industry benchmarks, companies can gauge their performance and identify areas for improvement.
Financial Analysis: Organizations employ descriptive analytics to manage their financial health by analyzing income statements, balance sheets, and cash flow statements. This analysis helps in understanding revenue streams, expenses, profitability, and liquidity positions.
Customer Behavior Analysis: By examining past purchasing behaviors, preferences, and interactions, companies can better understand their customers. This insight is critical for improving customer service, tailoring marketing strategies, and enhancing customer retention.
Inventory Management: Descriptive analytics aids in optimizing inventory levels by analyzing historical sales data, seasonality, and trends. This enables businesses to reduce carrying costs, minimize stockouts, and improve order fulfillment.
Supply Chain Management: Analyzing historical data related to supply chain operations helps businesses identify bottlenecks, evaluate supplier performance, and optimize logistics. This leads to more efficient supply chain operations and cost reductions.
Human Resources: HR departments use descriptive analytics to analyze employee data, including performance evaluations, retention rates, and hiring channels. This analysis supports workforce planning, employee development, and retention strategies.
Market Analysis: By examining historical market data, companies can identify market trends, customer needs, and competitive dynamics. This information is crucial for strategic planning, market positioning, and product development.
2.2 Diagnostic Analytics
Diagnostic analytics takes a step further from descriptive analytics by not just describing what has happened in the past, but also attempting to understand why it happened.
It involves drilling down into your data, discovering patterns, identifying anomalies, and investigating the causes behind observed events or behaviors. Diagnostic analytics is essentially about finding relationships among data points and determining the factors that contribute to a particular outcome.
2.2.1 How Diagnostic Analytics Works
The process typically involves the following steps:
Data Collection and Preparation: Gathering comprehensive data from various sources and ensuring it’s cleaned and formatted for analysis.
Identification of Anomalies: Using techniques to identify deviations from the norm, which could indicate issues or opportunities for further investigation.
Drill-Down Analysis: Delving deeper into data to explore the factors that contributed to the anomalies or trends. This could involve segmenting the data or looking at it from different perspectives.
Hypothesis Testing: Formulating hypotheses about what might be causing the trends or issues and testing these hypotheses through statistical methods.
Root Cause Analysis (RCA): Employing various RCA techniques to pinpoint the underlying causes of observed phenomena.
2.2.2 Techniques Used in Diagnostic Analytics
- Drill-Down: Breaking down data into smaller segments to find the root causes of variations in the data.
- Data Mining: Exploring large sets of data to find patterns and relationships.
- Correlation Analysis: Identifying relationships between variables to see how they move in relation to one another.
- Regression Analysis: Understanding the impact of variables on a particular outcome.
- Multivariate Testing: Comparing data across multiple variables to see how they interact with each other.
2.2.3 Applications of Diagnostic Analytics
Marketing
Marketers use diagnostic analytics to understand the factors driving campaign performance. By analyzing customer behaviors, purchase patterns, and engagement metrics, companies can identify what elements of their campaigns are most effective and why certain strategies did not perform as expected.
Finance
In finance, diagnostic analytics can help identify the causes of budget variances or financial anomalies. For instance, if a company’s operational costs have significantly increased, diagnostic analytics can be used to drill down into various cost centers and uncover specific factors contributing to the increase.
Operations
Operations managers can use diagnostic analytics to improve process efficiencies and reduce waste. By examining production data, companies can find bottlenecks or inefficiencies in their manufacturing processes and understand the underlying reasons for operational delays or quality issues.
Healthcare
Healthcare providers utilize diagnostic analytics to improve patient care outcomes. By analyzing patient data, medical professionals can identify patterns related to adverse events, understand factors contributing to patient readmissions, and develop strategies to improve patient care.
E-commerce
E-commerce platforms leverage diagnostic analytics to enhance customer experiences and increase sales. Analyzing customer behavior data helps understand why certain products are more popular, why some carts are abandoned, and what factors influence purchase decisions.
2.3 Predictive Analytics
Predictive analytics encompasses a suite of statistical techniques and models that analyze historical and current data to make predictions about future events or behaviors.
This branch of analytics is fundamentally about forecasting and is instrumental in various sectors for identifying trends, understanding customer behavior, managing risks, and optimizing operational processes. It leverages techniques from data mining, statistics, modeling, machine learning, and artificial intelligence to analyze and interpret data, thereby forecasting future probabilities with an acceptable level of reliability.
2.3.1 Key Components of Predictive Analytics
Data Collection: The foundation of any predictive analytics effort is data. This can include historical data, real-time data streams, structured data (like sales figures), and unstructured data (like social media posts).
Data Analysis: Before predictive modeling, data needs to be cleaned and analyzed to identify patterns, trends, and anomalies. This stage often involves exploratory data analysis (EDA) and data visualization.
Statistical Modeling: Predictive analytics uses various statistical models depending on the nature of the prediction and the data. Common models include regression analysis (linear and logistic regression), time series analysis, and complex algorithms like neural networks.
Machine Learning: Many predictive analytics applications utilize machine learning algorithms to process large datasets and improve predictions over time as more data becomes available. Algorithms can range from simple decision trees to complex deep learning models.
Validation: Models are validated using techniques such as cross-validation to ensure their accuracy and reliability. This step is crucial for assessing how the model will perform on unseen data.
Deployment: Once validated, predictive models are deployed within business processes or decision-making tools to provide real-time predictions and insights.
2.3.2 Applications of Predictive Analytics
Financial Services
- Credit Scoring: Banks and financial institutions use predictive analytics to assess the creditworthiness of loan applicants based on their historical financial data, transaction history, and other relevant factors.
- Fraud Detection: Predictive models analyze transaction patterns to identify potentially fraudulent activities, significantly reducing losses due to fraud.
Healthcare
- Disease Prediction: By analyzing patient data and medical histories, predictive analytics can identify individuals at risk of developing specific conditions, enabling preventative care measures.
- Treatment Personalization: Predictive models help in tailoring treatment plans to individual patients based on their unique medical histories and genetic information.
Retail
- Customer Lifetime Value Prediction: Retailers use predictive analytics to forecast the future value of customers, which informs marketing strategies and customer relationship management.
- Inventory Management: Predictive models forecast demand for products, helping retailers optimize their inventory levels and reduce stockouts or overstock situations.
Manufacturing
- Predictive Maintenance: By analyzing data from machinery sensors, predictive models can anticipate equipment failures before they happen, minimizing downtime and maintenance costs.
- Supply Chain Optimization: Predictive analytics can forecast supply chain disruptions and demand fluctuations, enabling more efficient supply chain management.
Marketing
- Customer Segmentation: Predictive analytics helps in segmenting customers based on predicted behaviors, preferences, and value, allowing for more targeted marketing campaigns.
- Churn Prediction: Companies use predictive models to identify customers who are likely to churn, enabling proactive measures to retain them.
2.4 Prescriptive Analytics
Prescriptive analytics represents the cutting edge of business analytics, offering not just insights or forecasts but actionable recommendations designed to guide decision-making toward optimal outcomes.
It synthesizes information from descriptive and predictive analytics to suggest specific actions and consider the implications of each decision option. By employing advanced techniques like optimization, simulation, and machine learning, prescriptive analytics helps businesses not only to anticipate future trends but also to shape them.
2.4.1 How Prescriptive Analytics Works
Prescriptive analytics uses a combination of data, mathematical models, and computational algorithms to recommend actions. It often involves the following steps and components:
Data Collection: Gathering and integrating data from various sources, including historical data, transactional data, real-time data feeds, and big data.
Predictive Models: Building on predictive analytics to forecast future scenarios based on the data collected.
Decision Variables: Identifying and defining the variables that decision-makers can control.
Constraints: Recognizing any limitations or restrictions that might impact decision-making (e.g., budgetary, regulatory, capacity constraints).
Optimization Algorithms: Using mathematical optimization to find the best outcome from a set of potential outcomes, based on the objectives and constraints defined.
Simulation: Employing simulation models to explore the potential outcomes of different decision paths in a risk-free environment. This can include stochastic modeling to account for uncertainty and variability in predictions.
Machine Learning: Leveraging machine learning algorithms to improve the accuracy of predictions and the efficacy of recommendations over time, adapting to new data and outcomes.
2.4.2 Applications of Prescriptive Analytics
Prescriptive analytics finds applications across various industries, optimizing decision-making processes and enhancing operational efficiency. Some notable applications include:
Supply Chain Optimization
Prescriptive analytics can optimize supply chain operations by determining the most efficient inventory levels, production schedules, and distribution paths. It can suggest adjustments to minimize costs, meet delivery times, and respond to changing market demands or disruptions in the supply chain.
Financial Services
In banking and finance, prescriptive analytics helps in portfolio management by suggesting investment strategies that maximize returns while mitigating risks. It can also guide credit risk management by recommending credit limits and loan conditions tailored to individual customer profiles.
Healthcare
Prescriptive analytics aids healthcare providers in improving patient care through personalized treatment plans and preventive care recommendations. It can also optimize resource allocation, such as staffing levels and equipment utilization, to improve service delivery and reduce costs.
Energy Management
For utilities and energy companies, prescriptive analytics can forecast energy demand and recommend the most efficient energy production and distribution strategies. This includes optimizing the mix of energy sources, scheduling maintenance to avoid disruptions, and improving energy trading decisions.
Marketing and Customer Engagement
Prescriptive analytics helps businesses develop targeted marketing campaigns by identifying the most effective channels, messages, and timing for different customer segments. It can also recommend strategies for enhancing customer engagement and loyalty based on predictive customer behavior models.
Manufacturing
In manufacturing, prescriptive analytics can recommend adjustments to production processes to maximize efficiency, minimize waste, and improve product quality. It can also suggest preventive maintenance schedules to avoid machine failures and downtime.
2.5 Cognitive Analytics
Cognitive analytics is an advanced area of analytics that seeks to mimic human reasoning and thought processes in a computerized model. It leverages technologies such as artificial intelligence (AI), machine learning, natural language processing (NLP), and data mining to analyze large volumes of data in a way that mimics human understanding and insight. This approach allows businesses to process and interpret unstructured data, such as text, images, and voice, in a sophisticated manner that traditional analytics methods cannot achieve. Cognitive analytics systems learn and evolve based on the information they process, continually improving and providing deeper insights over time.
2.5.1 Key Features of Cognitive Analytics
- Learning Capability: Unlike traditional analytics tools that follow predefined rules and algorithms, cognitive analytics systems learn from data patterns and human interactions, allowing them to adapt and make predictions or recommendations.
- Natural Language Processing (NLP): These systems can understand and interpret human language, enabling them to analyze text data from various sources like emails, social media, and webpages.
- Machine Learning: Through machine learning, cognitive analytics systems can improve their accuracy and efficiency as they process more data, identifying patterns and insights that were previously unnoticed.
- Data Mining: Cognitive analytics applies advanced data mining techniques to uncover relationships, patterns, and trends from vast and complex datasets.
2.5.2 Applications of Cognitive Analytics
The applications of cognitive analytics are diverse and impactful across various sectors:
1. Healthcare
- Personalized Medicine: By analyzing patient data and medical literature, cognitive analytics can help in creating personalized treatment plans that consider the patient’s unique health profile.
- Disease Prediction and Prevention: These systems can predict disease outbreaks and progression by analyzing patterns in health data, enabling preventative measures or early interventions.
2. Customer Service
- Chatbots and Virtual Assistants: Cognitive analytics powers sophisticated chatbots and virtual assistants that can understand and respond to customer queries in a natural, human-like manner, improving customer service and engagement.
- Personalized Recommendations: E-commerce platforms use cognitive analytics to analyze customer behavior and preferences to make personalized product recommendations.
3. Financial Services
- Fraud Detection: By analyzing transaction patterns and customer behavior, cognitive analytics can identify anomalies that may indicate fraudulent activity, enhancing security and reducing losses.
- Risk Management: These systems can assess and predict various financial risks by analyzing market data, helping companies to make informed decisions.
4. Marketing
- Consumer Insight: Cognitive analytics can process and analyze consumer data from social media, reviews, and feedback to gain insights into consumer behavior and preferences, informing targeted marketing strategies.
- Campaign Optimization: By analyzing the effectiveness of different marketing channels and strategies, businesses can optimize their campaigns for better engagement and ROI.
5. Supply Chain Management
- Predictive Maintenance: Analyzing data from equipment and sensors, cognitive analytics can predict when machines are likely to fail, scheduling maintenance before costly breakdowns occur.
- Inventory Optimization: By analyzing sales data, market trends, and supply chain constraints, these systems can optimize inventory levels, reducing costs and improving efficiency.