Code
!pip install jupyterJupyter Notebook is a powerful interactive computing environment widely used in business analytics, data science, and machine learning. It allows users to write and execute Python code in a web-based interface while combining code, text, and visualizations in a single document.
.ipynb files for easy sharing.The easiest way to install Jupyter Notebook is through Anaconda, which includes Python and many data science packages.
If you prefer installing Jupyter without Anaconda, use pip:
!pip install jupyterAfter installing, open Terminal (Mac/Linux) or Command Prompt (Windows) and type:
!jupyter notebookThis opens Jupyter Notebook in your web browser, where you can create new Python notebooks.
.ipynb (native format) or export to HTML/PDF.Jupyter Notebook makes it easy to analyze business data with Python.
import pandas as pd
import numpy as np
import matplotlib.pyplot as pltimport os
os.chdir('/Users/vijay/Library/CloudStorage/OneDrive-Personal/Documents/1 Professional/3 My Books/BADM/Python Basics')
df = pd.read_csv("Diabetes.csv")
df.head() Unnamed: 0 Age Gender ... C_Protein_Level Thyroid_Condition Diabetes_Status
0 1 48 Male ... 7.46 Yes Yes
1 2 18 Other ... 5.64 Yes No
2 3 21 Other ... 7.20 No Yes
3 4 25 Female ... 6.53 Yes No
4 5 78 Male ... 0.58 No Yes
[5 rows x 28 columns]print(df.describe()) # Summary statistics Unnamed: 0 Age ... Vitamin_D_Level C_Protein_Level
count 5292.000000 5292.000000 ... 5292.000000 5292.000000
mean 2646.500000 48.417989 ... 29.909883 5.258743
std 1527.813143 18.040544 ... 11.527951 2.754500
min 1.000000 18.000000 ... 10.000000 0.500000
25% 1323.750000 33.000000 ... 20.000000 2.880000
50% 2646.500000 48.000000 ... 29.800000 5.270000
75% 3969.250000 64.000000 ... 39.900000 7.660000
max 5292.000000 79.000000 ... 50.000000 10.000000
[8 rows x 13 columns]print(df.isnull().sum()) # Check missing valuesUnnamed: 0 0
Age 0
Gender 0
BMI 0
Family_History 0
Physical_Activity 0
Diet_Type 0
Smoking_Status 0
Alcohol_Intake 1780
Stress_Level 0
Hypertension 0
Cholesterol_Level 0
Fasting_Blood_Sugar 0
Postprandial_Blood_Sugar 0
HBA1C 0
Heart_Rate 0
Waist_Hip_Ratio 0
Urban_Rural 0
Health_Insurance 0
Regular_Checkups 0
Medication_For_Chronic_Conditions 0
Pregnancies 0
Polycystic_Ovary_Syndrome 0
Glucose_Tolerance_Test_Result 0
Vitamin_D_Level 0
C_Protein_Level 0
Thyroid_Condition 0
Diabetes_Status 0
dtype: int64import matplotlib.pyplot as plt
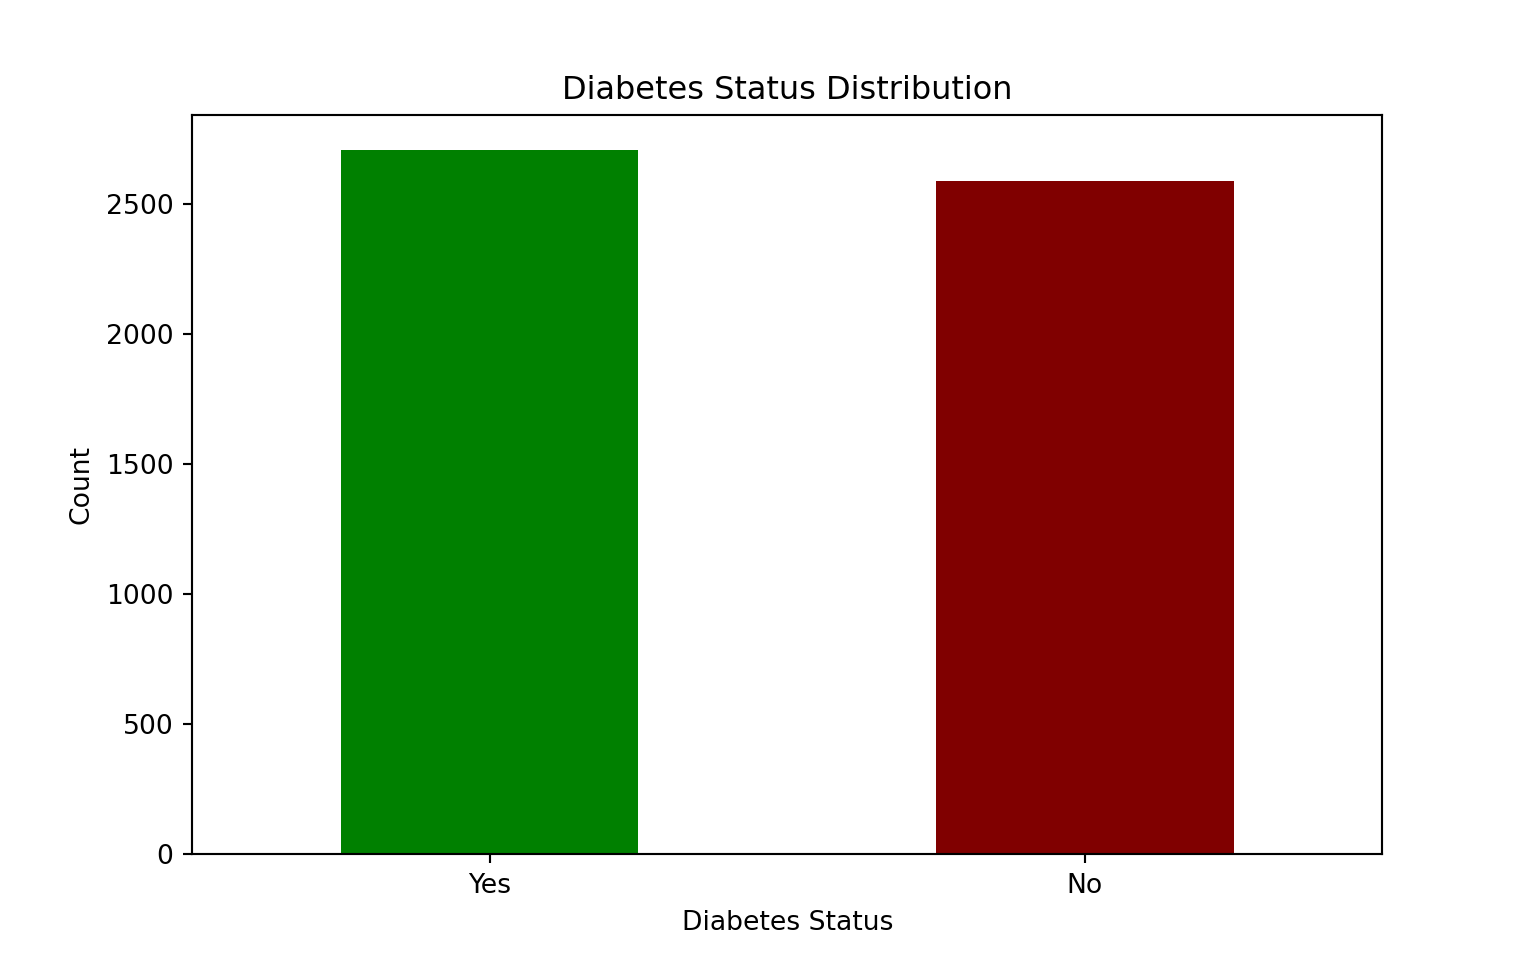
# Count the number of occurrences for each Diabetes Status
diabetes_counts = df["Diabetes_Status"].value_counts()
# Create a bar chart
plt.figure(figsize=(8,5))
diabetes_counts.plot(kind="bar", color=["green", "maroon"])
# Add labels and title
plt.title("Diabetes Status Distribution")
plt.xlabel("Diabetes Status")
plt.ylabel("Count")
plt.xticks(rotation=0) # Keep labels horizontal(array([0, 1]), [Text(0, 0, 'Yes'), Text(1, 0, 'No')])# Show plot
plt.show()