Code
install.packages("ggplot2")Packages in R can be installed from various sources, but the Comprehensive R Archive Network (CRAN) is the most common source. To install a package from CRAN, you can use the install.packages() function. This function downloads and installs the package binaries.
After a package is installed, it must be loaded into the session to use its functionalities. To load a package, use the library() function.
ggplot2 package, which is a very popular package for data visualization, you would use the following command in the R console:install.packages("ggplot2")`library(ggplot2)`Using plot().
With ggplot2().
Let’s go through a simple example of installing and loading the ggplot2 package, then using it to create a basic plot.
First, ensure ggplot2 is installed (you only do this once):
install.packages("ggplot2")Next, load the ggplot2 package:
Now, let’s create a simple scatter plot. We’ll use the mtcars dataset, which is included in base R, plotting mpg (miles per gallon) against hp (horsepower):
ggplot(mtcars, aes(x = hp, y = mpg)) +
  geom_point() +
  labs(title = "Car Mileage vs. Horsepower",
       x = "Horsepower",
       y = "Miles per Gallon")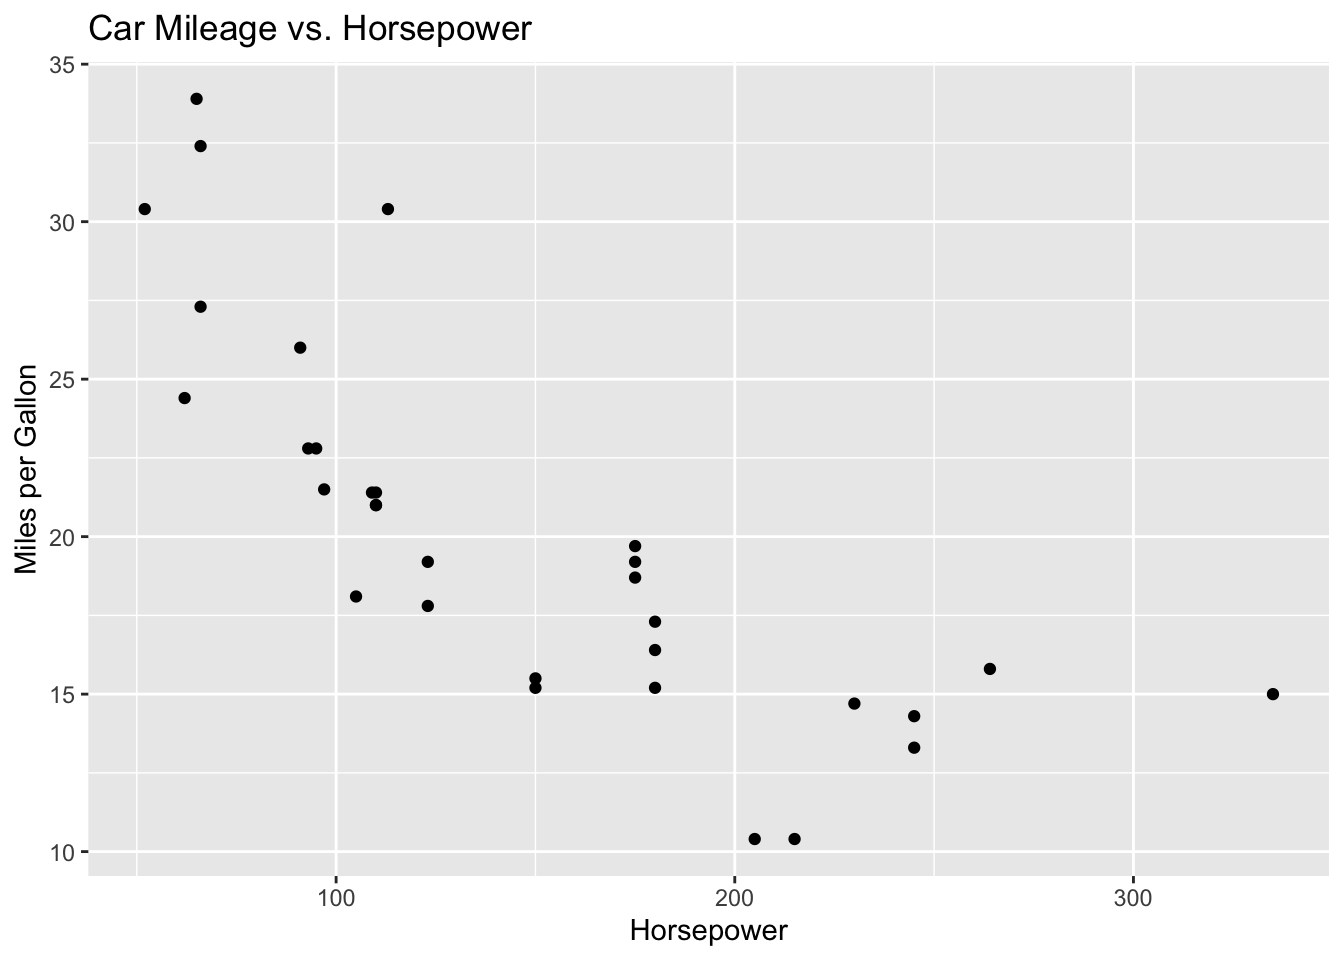
This command uses ggplot() to initiate the plot, specifying mtcars as the dataset and mapping hp to the x-axis and mpg to the y-axis with aes(). geom_point() adds the points to the plot, and labs() is used to add labels.