Code
# Print "Hello, World!" to the console
print("Hello, World!")
[1] "Hello, World!"R is a powerful programming language used extensively for statistical computing and graphics. It provides a wide array of techniques for data analysis, including linear and nonlinear modeling, classical statistical tests, time-series analysis, classification, clustering, and more. Its syntax allows users to easily manipulate data, perform calculations, and create graphical displays. Here’s a breakdown of some fundamental aspects of R syntax and an example to illustrate how it works.
Variables: In R, you can create variables without declaring their data type. You simply assign values directly with the assignment operator <- or =.
Comments: Comments start with the # symbol. Everything to the right of the # in a line is ignored by the interpreter.
Vectors: One of the basic data types in R is the vector, which you create using the c() function. Vectors are sequences of elements of the same type.
Functions: Functions are defined using the function keyword. They can take inputs (arguments), perform actions, and return a result.
Conditional Statements: R supports the usual if-else conditional constructs.
Loops: For iterating over sequences, R provides for, while, and repeat loops.
Packages: R’s functionality is extended through packages, which are collections of functions, data, and compiled code. You can install packages using the install.packages() function and load them with library().
.R extension) without opening an interactive R session.Creating and using R scripts in RStudio is a fundamental skill for anyone working with data in R. RStudio, being a powerful IDE for R, streamlines the process of writing, running, and managing R scripts. Here’s a concise guide based on insights from various sources:
Start a New Script: To begin, navigate to File -> New File -> R Script. This opens a new script tab in the top-left pane where you can write your code.
Writing Code: You can type your R code directly into this script pane. Common tasks include importing data, data manipulation, statistical analysis, and plotting. For instance, to create and print a variable, simply type something like result <- 3 followed by print(result) to see the output in the Console pane.
Running Code: To execute your code, you can click the Run button at the top of the script pane, or use keyboard shortcuts (e.g., Ctrl+Enter on Windows). The output will appear in the Console pane at the bottom.
Below are a few examples of basic R scripts that demonstrate common tasks in R.
A simple script that prints “Hello, World!” to the console.
# Print "Hello, World!" to the console
print("Hello, World!")[1] "Hello, World!"This script performs basic arithmetic operations and prints the results.
# Perform arithmetic operations
add <- 5 + 3

# Print the results
add
[1] 8This example demonstrates how to create two numerical vectors, perform an operation on them, and then plot the result.
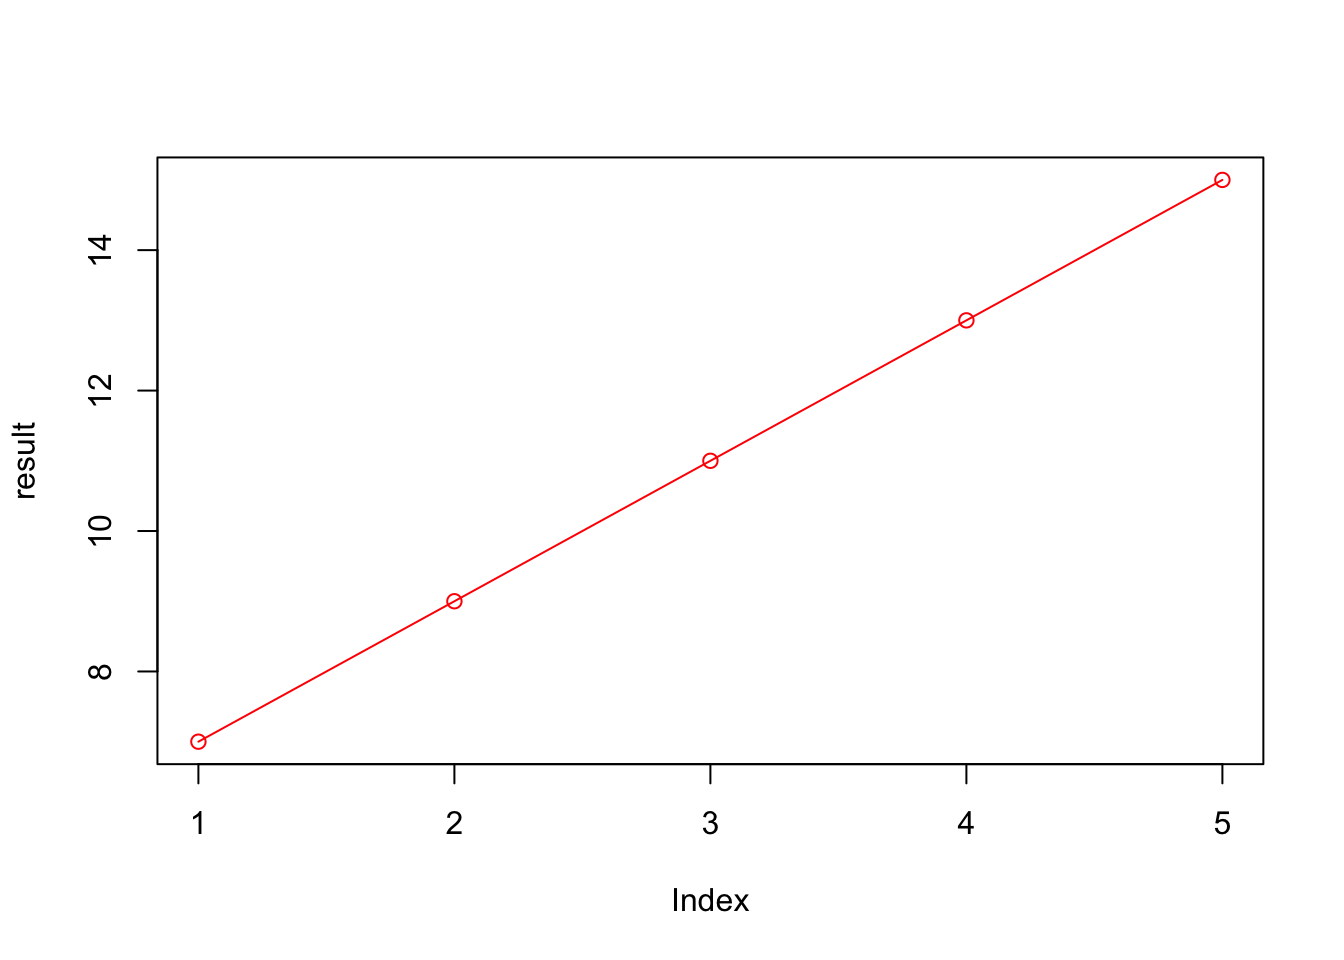
In this example: - Two vectors, vector1 and vector2, are created using the c() function. - These vectors are then added together, resulting in the result vector. The addition is done element-wise: the first element of vector1 is added to the first element of vector2, and so on. - Finally, the plot() function is used to visualize result. The type = "o" argument specifies that both the points and the lines connecting them should be plotted, and col = "red" changes the color of the plot to red.
These examples introduce the basics of writing and running R scripts with Rscript. As you become more familiar with R’s syntax and features, you can write more complex scripts to automate a wide range of data analysis and statistical tasks.